Financial Strategy FAQ
Everything you need to know about visualizing your path to wealth and mastering your debt.
Visual Guide
Our visualizer helps you see the 'inflection point'—the moment your wealth begins to accelerate.
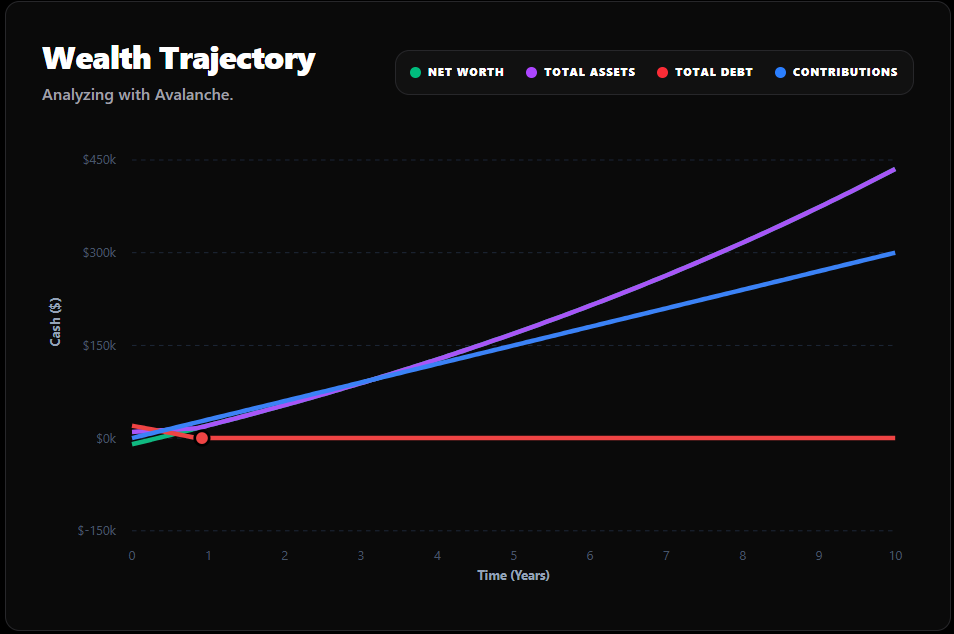
Red Line
Total Outstanding Debt
Purple Line
Gross Asset Value
Green Line
Net Worth (Assets - Debt)
Blue Line
Total Cumulative Contributions
General Questions
What is the 'Inflection Point' in finance?
The inflection point is the mathematical moment where the potential growth of your investments begins to outweigh the cost of your debt interest. Wealth Trajectory helps you visualize exactly when this happens based on your specific numbers.
Is the Debt Avalanche or Snowball method better?
Mathematically, the Avalanche method (paying highest interest first) saves the most money. However, the Snowball method (paying smallest balance first) is often more successful for people because it builds psychological momentum through quick wins.
Should I pay off my mortgage or invest in XEQT?
This depends on your mortgage interest rate vs. expected market returns. If your mortgage is at 5% and XEQT returns 8%, you might build more wealth by investing. However, paying down a mortgage is a guaranteed 5% return, whereas the market has risks.
How does Wealth Trajectory calculate these projections?
We use standard compounding interest formulas for both debt and investments. The tool simulates your monthly budget allocation across all accounts over your chosen time horizon, accounting for minimum payments and strategy-based surpluses.
What do the different lines on the chart represent?
The chart visualizes four key metrics: The Red line shows your total outstanding debt; the Purple line tracks your total gross assets; the Green line represents your Net Worth (Assets minus Debt); and the Blue line shows your cumulative contributions over time.
Common Scenarios
Explore specifically tuned calculators for the most common Canadian financial dilemmas.
Visualizing Snowball vs. Avalanche Debt Repayment
Compare the psychological wins of the Debt Snowball strategy against the mathematical optimization of the Debt Avalanche method with our visual calculator.
Should You Pay Off OSAP or Invest in Index Funds?
The definitive calculator for Canadian students. Compare the 0% interest period and future floating rates of OSAP against historical S&P 500 or TSX returns.
XEQT vs. Debt: Where Should Your Next Dollar Go?
Use real-time math to decide between investing in all-equity ETFs like XEQT and paying down high-interest or low-interest debt.